Unlocking Insights: A Deep Dive into Open Source Observability Tools
In today’s complex digital landscape, understanding the performance and health of your systems is paramount. This is where observability comes in – the ability to infer the internal state of a system from its external outputs. And increasingly, organizations are turning to open source observability tools to achieve this. Why? Because they offer flexibility, community support, and often, a lower total cost of ownership compared to proprietary solutions. This article explores the world of open source observability tools, examining their benefits, key players, and how to choose the right ones for your needs. We’ll delve into the core concepts of observability – metrics, logs, and traces – and how these tools help you collect, analyze, and visualize this crucial data. Whether you’re a seasoned DevOps engineer or just starting your journey into system monitoring, this guide will provide valuable insights into the power of open source observability tools.
The Rise of Open Source in Observability
The shift towards open source observability tools is driven by several factors. One key aspect is the increasing complexity of modern applications. Microservices architectures, cloud-native deployments, and distributed systems generate vast amounts of data, making it challenging to pinpoint the root cause of performance issues. Traditional monitoring tools often fall short in these environments, lacking the scalability and flexibility required to handle the volume and variety of data.
Open source observability tools, on the other hand, are designed to be scalable and adaptable. They leverage open standards and protocols, allowing them to integrate seamlessly with a wide range of technologies. The open source nature also fosters collaboration and innovation, with a vibrant community of developers constantly contributing to and improving the tools. This collaborative environment ensures that these tools stay up-to-date with the latest technologies and best practices.
Core Pillars of Observability: Metrics, Logs, and Traces
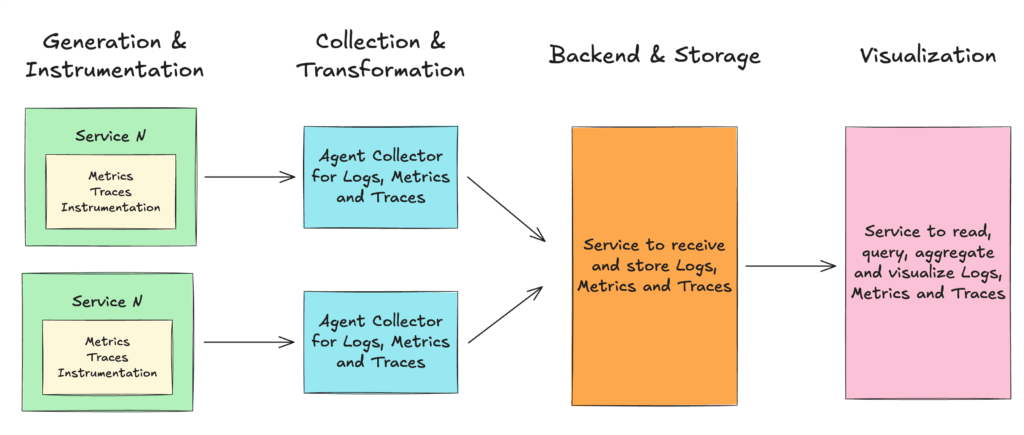
Observability is built upon three fundamental pillars: metrics, logs, and traces. Understanding these pillars is crucial for effectively utilizing open source observability tools.
Metrics
Metrics are numerical measurements that provide insights into the performance of a system over time. Examples include CPU utilization, memory usage, request latency, and error rates. Open source observability tools provide mechanisms for collecting, storing, and visualizing metrics, allowing you to identify trends, detect anomalies, and proactively address potential issues. Popular tools for collecting and storing metrics include Prometheus and Graphite. [See also: Prometheus Monitoring Best Practices]
Logs
Logs are textual records of events that occur within a system. They provide detailed information about what happened, when it happened, and who or what was involved. Analyzing logs can help you diagnose errors, track user activity, and understand the behavior of your applications. Open source observability tools offer features for log aggregation, indexing, and searching, making it easier to sift through large volumes of log data and find relevant information. Examples of tools in this space include Elasticsearch, Fluentd, and Loki. [See also: ELK Stack Tutorial]
Traces
Traces track the path of a request as it traverses through a distributed system. They provide insights into the interactions between different services and components, allowing you to identify bottlenecks and understand the flow of requests. Tracing is particularly valuable in microservices architectures where a single request may involve multiple services. Open source observability tools like Jaeger and Zipkin enable you to collect, analyze, and visualize traces, providing a comprehensive view of the request lifecycle. [See also: Distributed Tracing Explained]
Key Open Source Observability Tools
The open source observability tools landscape is rich and diverse, with a wide range of options available for different use cases and requirements. Here are some of the key players:
- Prometheus: A popular time-series database and monitoring system, widely used for collecting and storing metrics. Prometheus excels at monitoring dynamic environments and supports a powerful query language called PromQL.
- Grafana: A data visualization dashboard that allows you to create custom dashboards and visualize data from various sources, including Prometheus, Graphite, and Elasticsearch. Grafana provides a user-friendly interface for exploring and analyzing your data.
- Elasticsearch: A distributed search and analytics engine that is commonly used for log aggregation and analysis. Elasticsearch provides powerful search capabilities and supports a wide range of data formats.
- Kibana: A data visualization dashboard that works seamlessly with Elasticsearch. Kibana allows you to create interactive dashboards and explore your log data in real-time.
- Jaeger: A distributed tracing system that helps you track the path of requests through a distributed system. Jaeger supports various tracing protocols and integrates with popular programming languages and frameworks.
- Zipkin: Another popular distributed tracing system that provides similar functionality to Jaeger. Zipkin is known for its ease of use and integration with various technologies.
- Loki: A log aggregation system inspired by Prometheus. Loki focuses on indexing metadata rather than the log content itself, making it efficient for storing and querying large volumes of log data.
- Fluentd: An open-source data collector for unified logging layer. Fluentd allows you to collect logs from various sources and forward them to different destinations, such as Elasticsearch, S3, and Kafka.
- OpenTelemetry: A vendor-neutral, open-source observability framework for collecting traces, metrics, and logs. OpenTelemetry aims to standardize the way observability data is collected and exported, making it easier to switch between different open source observability tools.
Choosing the Right Open Source Observability Tools
Selecting the right open source observability tools for your organization requires careful consideration of your specific needs and requirements. Here are some factors to consider:
- Scalability: Can the tools handle the volume and velocity of data generated by your systems?
- Integration: Do the tools integrate seamlessly with your existing infrastructure and applications?
- Ease of use: Are the tools easy to install, configure, and use?
- Community support: Is there a strong and active community supporting the tools?
- Cost: What is the total cost of ownership, including hardware, software, and personnel costs?
- Features: Do the tools provide the features you need to effectively monitor and troubleshoot your systems? Consider whether you need advanced analytics, anomaly detection, or alerting capabilities.
- Security: Do the tools have adequate security features to protect your sensitive data?
It’s often beneficial to start with a pilot project to evaluate different open source observability tools in a real-world environment. This will allow you to gain hands-on experience with the tools and determine which ones best fit your needs.
Implementing Open Source Observability: Best Practices
Successfully implementing open source observability tools requires more than just installing the software. Here are some best practices to follow:
- Define clear observability goals: What do you want to achieve with observability? What metrics, logs, and traces are most important to you?
- Instrument your applications: Add code to your applications to generate metrics, logs, and traces. Use libraries and frameworks that are compatible with your chosen open source observability tools.
- Automate the deployment process: Use configuration management tools to automate the deployment and configuration of your observability infrastructure.
- Establish alerting policies: Define clear alerting policies based on your observability data. Ensure that alerts are routed to the appropriate teams and individuals.
- Continuously monitor and improve your observability infrastructure: Regularly review your observability data and identify areas for improvement. Stay up-to-date with the latest features and best practices of your chosen open source observability tools.
- Foster a culture of observability: Encourage collaboration between development, operations, and security teams to promote a shared understanding of system behavior.
The Future of Open Source Observability
The future of open source observability tools is bright. As systems become increasingly complex and distributed, the need for robust observability solutions will only continue to grow. Open source tools are well-positioned to meet this demand, offering flexibility, scalability, and community support. Expect to see continued innovation in this space, with new tools and techniques emerging to address the evolving challenges of modern system monitoring.
The rise of cloud-native technologies and microservices architectures will further drive the adoption of open source observability tools. These tools will play a critical role in ensuring the reliability and performance of these complex systems. Furthermore, the integration of artificial intelligence (AI) and machine learning (ML) into observability tools will enable more advanced analytics and anomaly detection, helping organizations proactively identify and resolve issues before they impact users.
Conclusion
Open source observability tools are essential for understanding the health and performance of modern systems. By leveraging these tools, organizations can gain valuable insights into their applications, infrastructure, and user experience. The open source nature of these tools fosters collaboration and innovation, ensuring that they stay up-to-date with the latest technologies and best practices. By carefully selecting and implementing the right open source observability tools, organizations can unlock the full potential of their data and achieve a higher level of operational excellence. As the complexity of systems continues to increase, open source observability tools will become even more critical for ensuring the reliability and performance of the digital world.
